DOCUMENT f
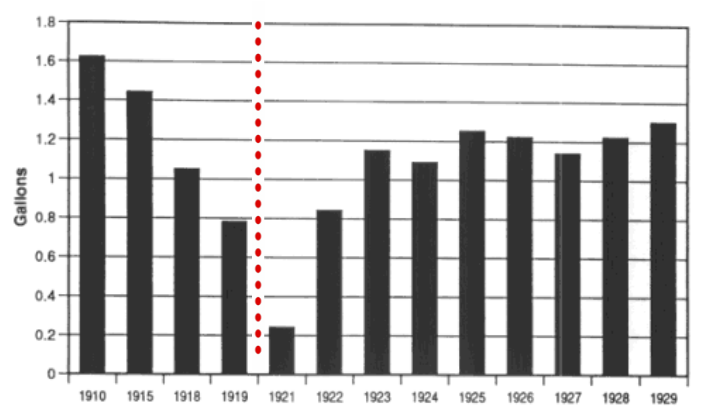
The graph above shows average gallons of alcohol drank per person (total gallons of alcohol consumed divided by the total population) between 1910 and 1929. When reading this chart, remember that Prohibition began in 1920 and ended in 1933.
Analyze the Chart and then Respond to the Questions Below.
Analyze the Chart and then Respond to the Questions Below.
|
|
|
